
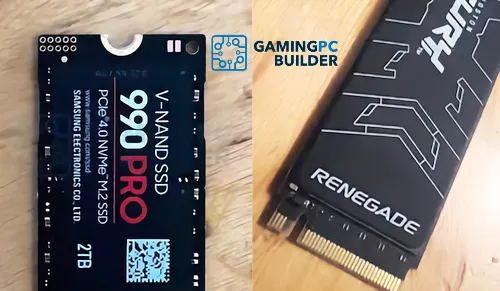
 Kingston's Fury Renegade is an updated version of the KC3000. It uses the same high-end combination of a Phison E18 controller and 176-layer Micron NAND circuitry but offers slightly better performance. As such, the Fury Renegade is still the flagship Gen4 M.2 SSD from Kingston in 2023.
Similarly, the 990 PRO is still Samsung's fastest consumer SSD in the second half of 2023, as neither of the two storage giants offers SSDs utilizing the faster PCIe Gen5 interface.
The 990 PRO is widely seen as the fastest SSD in the Gen4/NVMe category and usually commands a higher price than its Kingston competitor. But how do they actually differ in synthetic benchmarks and real-world scenarios?
Fury Renegade Vs. 990 PRO: Specifications
This is how the 2TB capacities of the Kingston Fury Renegade and Samsung 990 Pro compare on paper. Full lineup specs are listed at the bottom of this page.
The Fury Renegade and 990 PRO seem to be evenly matched when you look at the specifications. Both use 176-layer TLC NAND along with a 2 GB DDR4 DRAM buffer, which places both drives in the high-end space.
Sequential performance also more or less max out the PCI-Express 4.0 interface in both cases, but the Samsung SSD pulls ahead in the random IOPS area (often a solid indicator of real-world performance).
While not performance-related, it should also be pointed out that the Kingston Fury Renegade offers a significantly better endurance rating than its Samsung counterpart.
Fury Renegade Vs. 990 PRO: Performance
In any event, specification tables are not the same thing as real-world performance. Here is our comparison data, based on our full reviews of the 2TB Samsung 990 PRO and the 2TB Kingston Fury Renegade.
AS SSD Sequential Performance
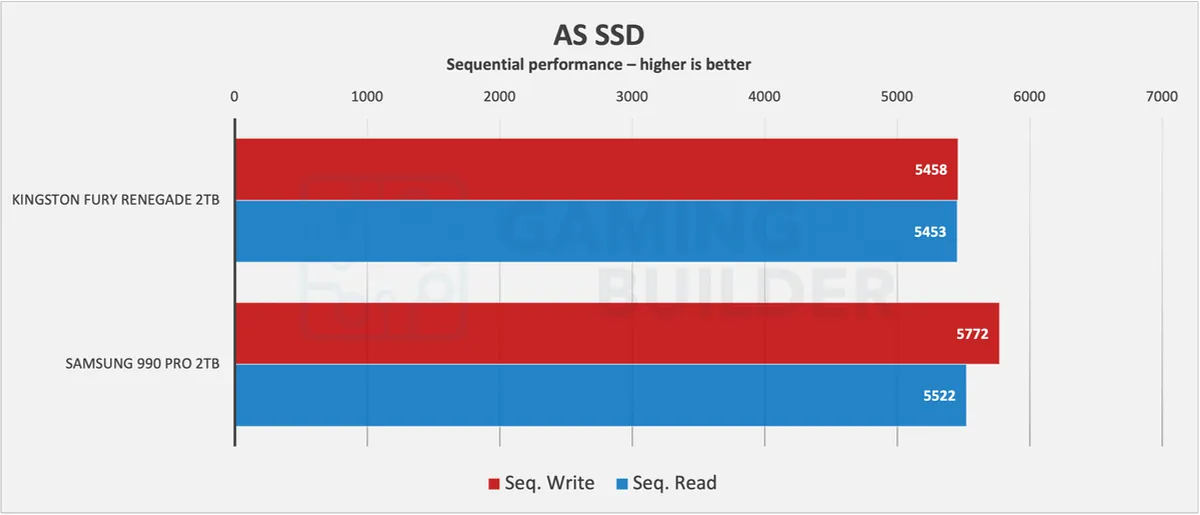
Sequential performance results from the AS SSD benchmark are lower than the specified maximums, as it measures using non-compressible data. That doesn't stop the Kingston Fury Renegade from Samsung 990 PRO from being top performers compared to most other SSDs. The 990 PRO is nevertheless slightly faster.
CrystalDiskMark Sequential & Random Performance
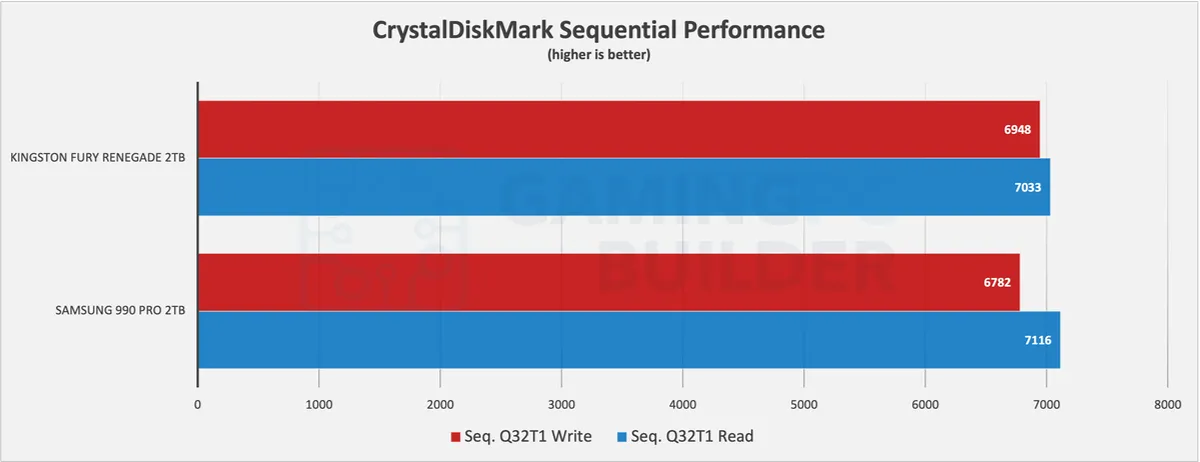
CrystalDiskMark results are typically closer to theoretical maximum performance. Here, the results are mixed, with the Fury Renegade being ahead by 2,4% in writes and the Samsung leading by 1,2% in sequential reads. Largely irrelevant differences in both cases.
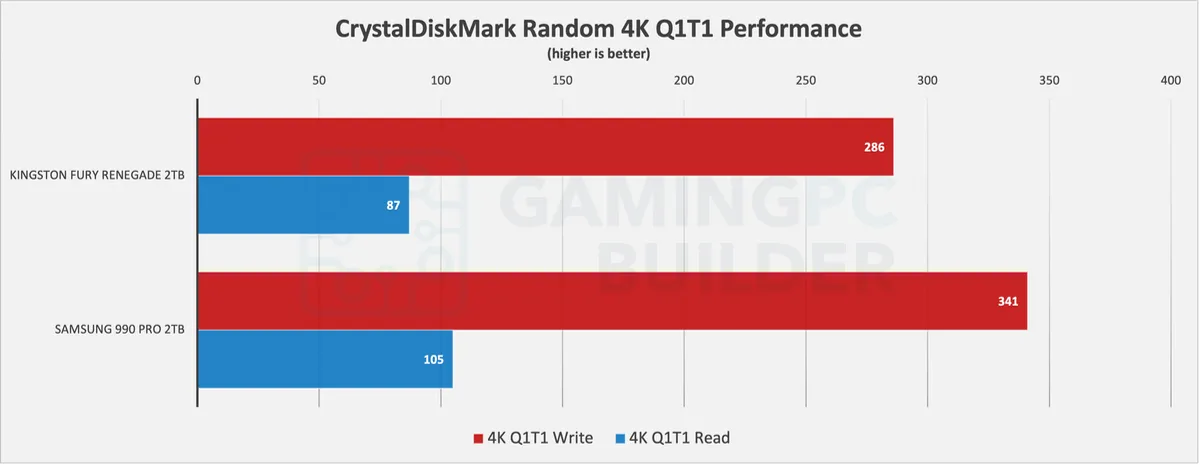
More significant differences can be spotted with 4K random data at minimum queue depth – an area that mirrors many real-world scenarios. The Samsung 990 PRO is ahead of its rival here, by 20.1% (read) and 19% (write), respectively.
Latency (Anvil's Storage Utilities)
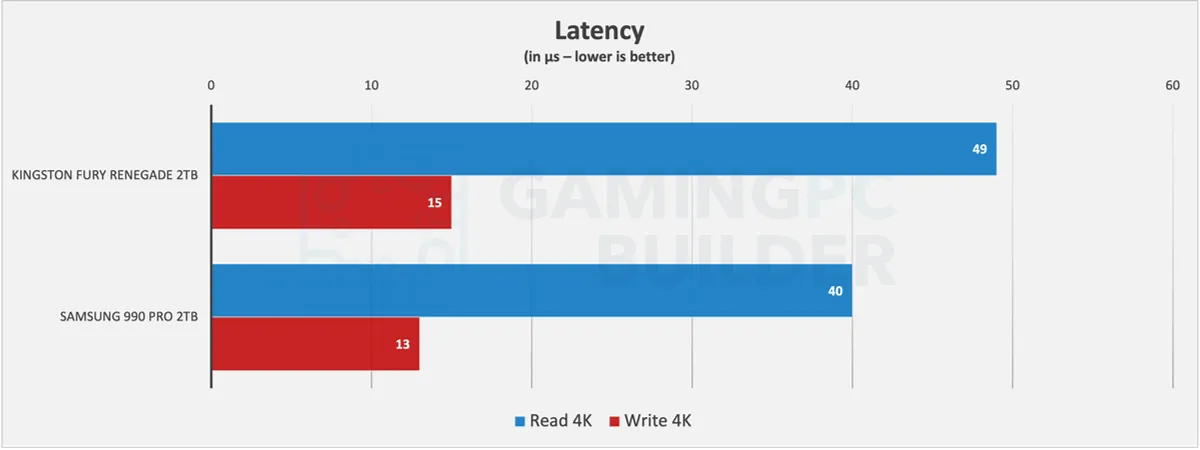
Latency is important in most everyday workloads. Again, the Samsung 990 PRO is more responsive than the Kingston Fury Renegade by 22.5% and 15.4%, respectively, in read/write latency at 4K.
Fury Renegade Vs. 990 PRO: Real-World Performance
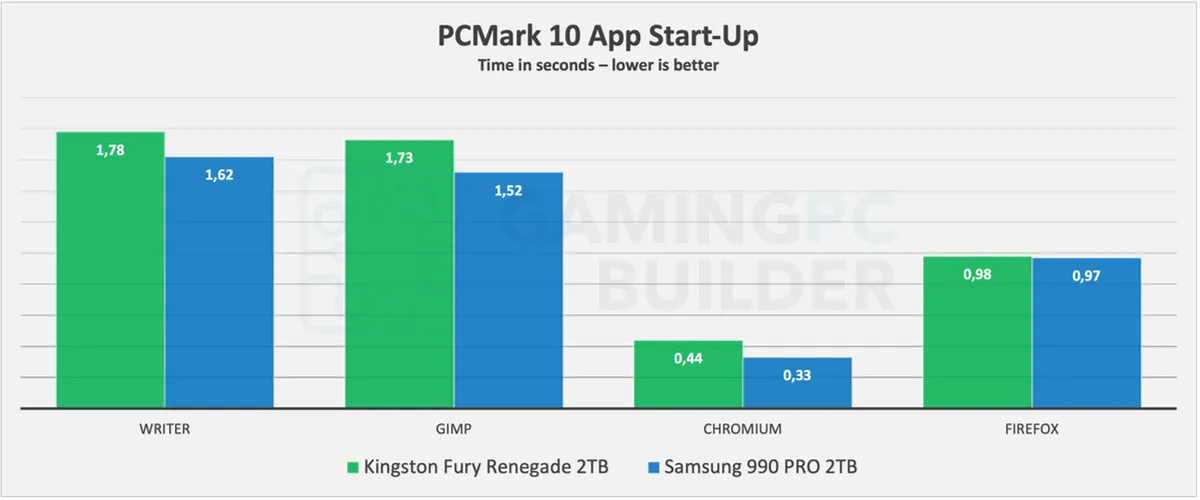
PCMark 10 includes an "App Start-up times" test using a variety of common office apps. The 990 PRO is faster than the Fury Renegade on average.
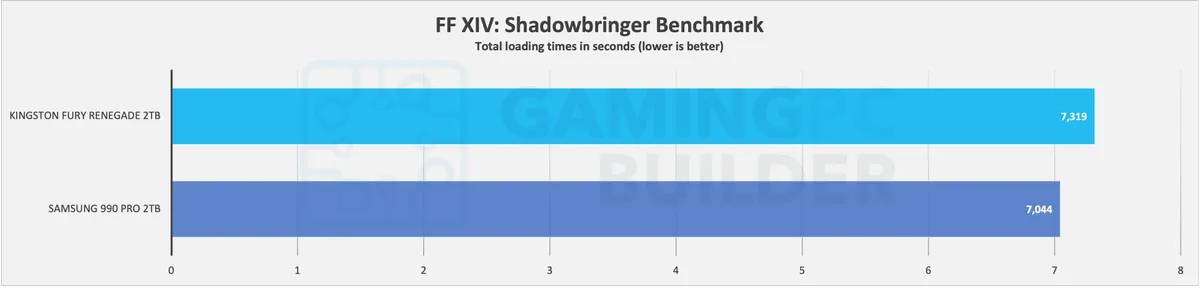
The 990 PRO's slight lead over the Fury Renegade can also be seen in the standalone Final Fantasy Shadowbringer benchmark. This test combines loading times for five different game levels. Of course, a difference of 0.3 seconds across five different levels is not enough to be noticeable. In fact, even an external SSD in an M.2 enclosure can offer more than decent performance in this benchmark.
3DMark Storage Benchmark
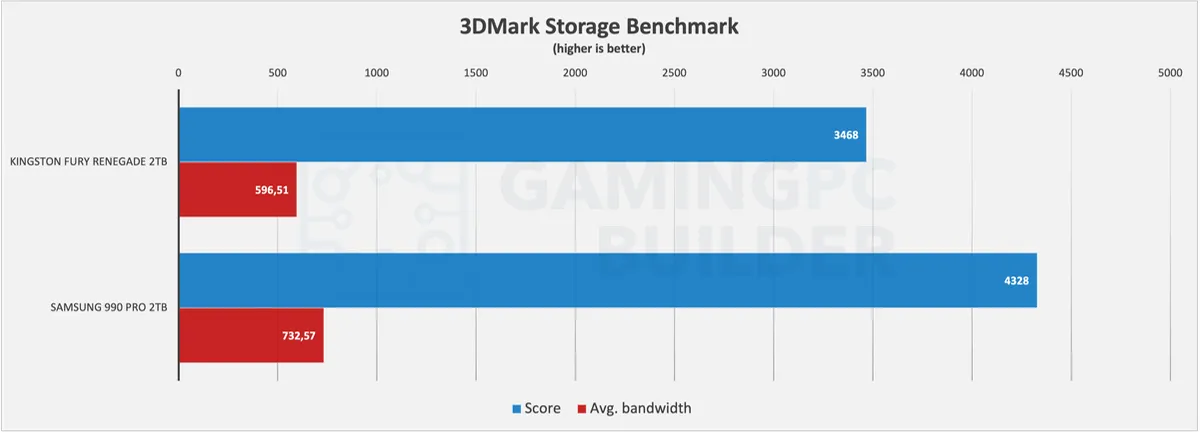
The storage benchmark built into 3DMark uses a more comprehensive range of gaming tasks including level loading as well as installation, copying, and recording. Here, Samsung's 990 PRO ends up being 22.8% faster than the Kingston Fury Renegade.
PlayStation 5 Read Speed Test
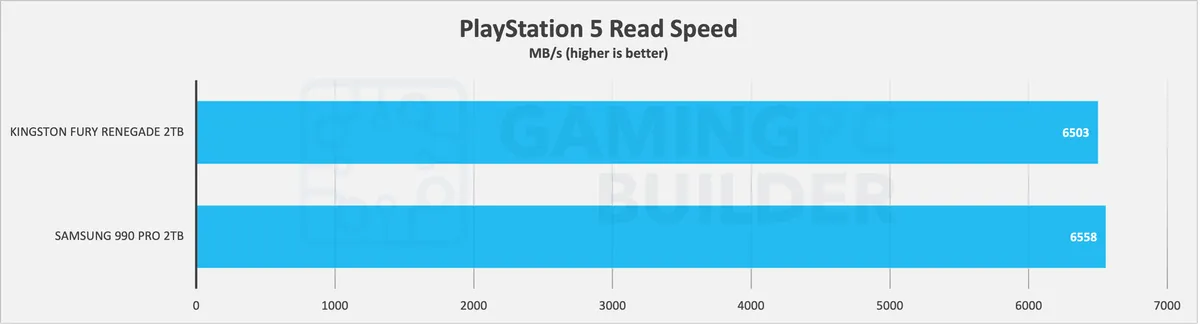
Both the Samsung 990 PRO and Kingston Fury Renegade easily exceed Sony's minimum specs for use as PS5 storage expansion drives, although you should opt for the variants equipped with a heatsink to fully comply with Sony's recommendations. The difference between the two SSDs is negligible in the PS5's built-in read speed test.
Conclusion
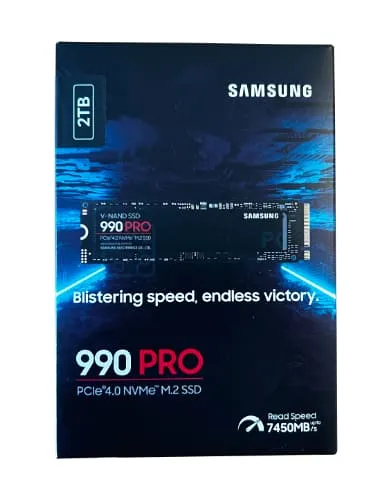
Although its maximum sequential performance isn't always faster, the Samsung 990 PRO is ahead of the Kingston Fury Renegade on average. However, the differences are not necessarily noticeable as they are often measured in fractions of a second.
read more:
- Full review of the 2TB 990 PRO
- Full review of the 2TB Kingston Fury Renegade
- Comparison of the 990 PRO and WD_Black SN850X
- Ranking of the best M.2 SSDs
- Ranking of the fastest SSDs overall (incl. SATA)
Samsung 990 PRO Series Specifications
| Samsung 990 PRO Specifications |
1TB | 2TB | 4TB |
|---|---|---|---|
| Form Factor | M.2 2280 | M.2 2280 | M.2 2280 |
| Interface/ Protocol |
PCIe 4.0 x4/ NVMe 2.0 |
PCIe 4.0 x4/ NVMe 2.0 |
PCIe 4.0 x4/ NVMe 2.0 |
| Controller | Pascal | Pascal | Pascal |
| DRAM | 1GB LPDDR4 | 2GB LPDDR4 | 4GB LPDDR4 |
| Memory | 176-layer 3D TLC |
176-layer 3D TLC |
176-layer 3D TLC |
| Sequential Read | 7,450 MB/s | 7,450 MB/s | 7,450 MB/s |
| Sequential Write | 6,900 MB/s | 6,900 MB/s | 6,900 MB/s |
| Random Read | 1.2M IOPS | 1.4M IOPS | 1.4M IOPS |
| Random Write | 1.55M IOPS | 1.55M IOPS | 1.55M IOPS |
| Endurance | 600 TBW | 1,200 TBW | 2,400 TBW |
| Warranty | 5-Year | 5-Year | 5-Year |
WD Black SN850X Series Specifications
| Kingston Fury Renegade |
500GB | 1TB | 2TB | 4TB |
|---|---|---|---|---|
| Form Factor | M.2 2280 | M.2 2280 | M.2 2280 | M.2 2280 |
| Interface / Protocol | PCIe 4.0 x4 / NVMe 1.4 | PCIe 4.0 x4 / NVMe 1.4 | PCIe 4.0 x4 / NVMe 1.4 | PCIe 4.0 x4 / NVMe 1.4 |
| Controller | Phison E18 | Phison E18 | Phison E18 | Phison E18 |
| DRAM | 512 MB DDR4-2666 | 1 GB DDR4-2666 | 2 GB DDR4-2666 | 4 GB DDR4-2666 |
| Memory | 176-Layer TLC | 176-Layer TLC | 176-Layer TLC | 176-Layer TLC |
| Sequential Read | 7,300 MB/s | 7,300 MB/s | 7,300 MB/s | 7,300 MB/s |
| Sequential Write | 3,900 MB/s | 6,000 MB/s | 7,000 MB/s | 7,000 MB/s |
| Random Read | 450K IOPS | 900K IOPS | 1M IOPS | 1M IOPS |
| Random Write | 900K IOPS | 1M IOPS | 1M IOPS | 1M IOPS |
| Endurance | 500 TBW | 1,000 TBW | 2,000 TBW | 4,000 TBW |
| Warranty | 5 Years | 5 Years | 5 Years | 5 Years |
| Latest Price* | ||||
| Shopping Links | Amazon Newegg |
Comments (2)
- AvyaanWhy is there basically no difference in the PS5 test?
- Jesper BergHey Avyaan, TBH the built-in PS5 benchmark isn't overly useful for predicting actual performance, but it's the only one available... In reality, any high-end drive will do just nicely.
Comments are closed.