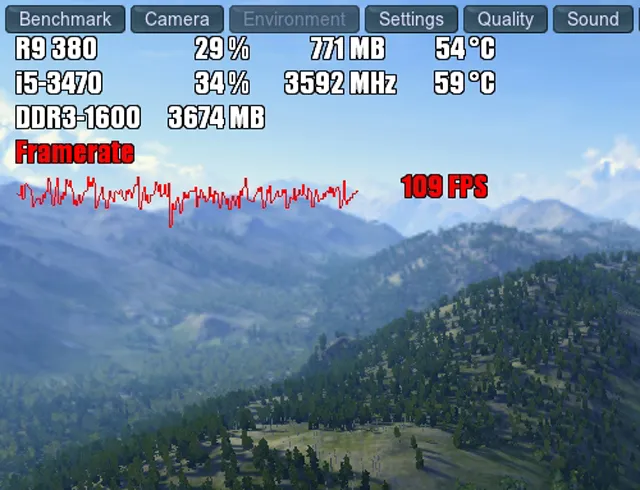

Installation and Initial Settings
1. Download MSI Afterburner from the MSI website and install it with the Rivatuner Statistics server.
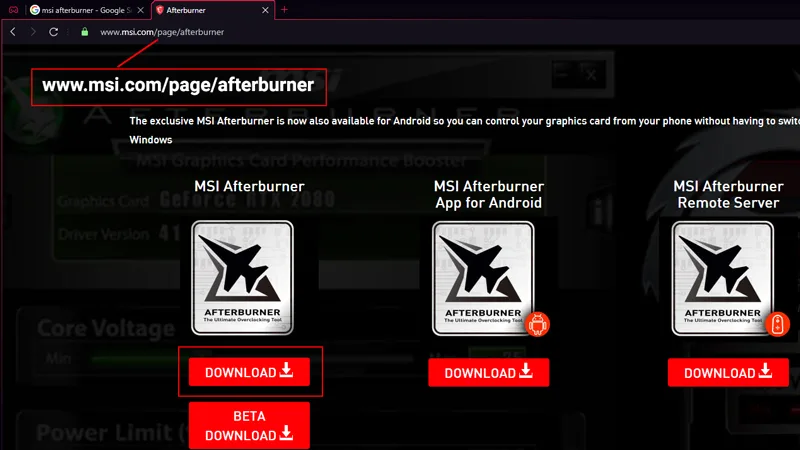
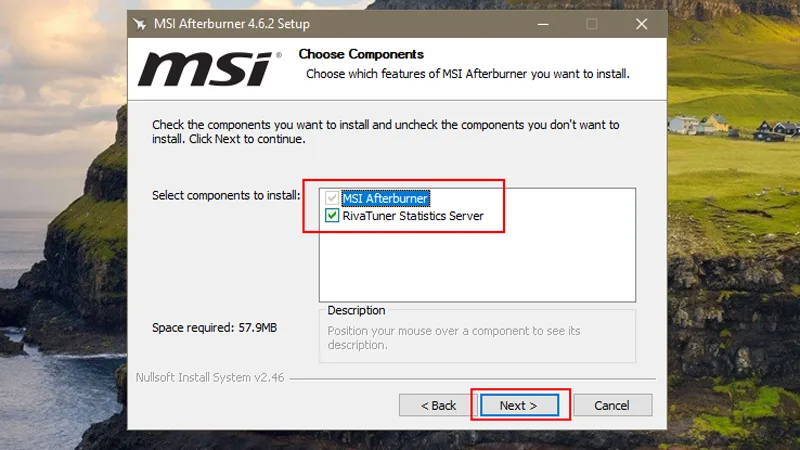
You can separately download and install the Rivatuner Statistics Server if needed. Download it from here.
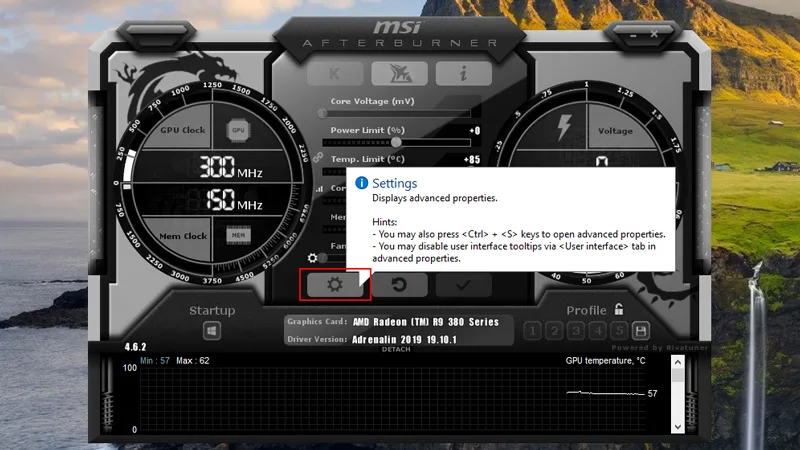
2. In the MSI Afterburner interface, click the gear icon to open the settings window.
3. Click the monitoring tab then click the checkmark beside the metric you want to display and click the checkbox for “Show in On-Screen Display” in the “properties” section and click the “Apply” button.
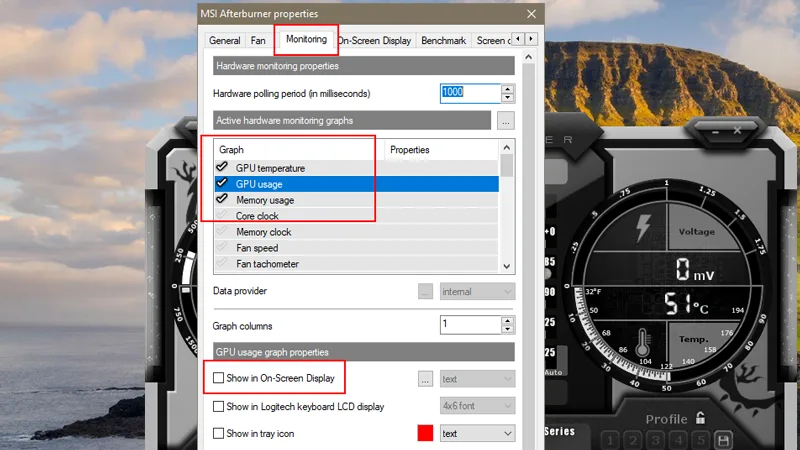
Select:
-
- GPU Usage
- Memory Usage
- GPU Temperature
- CPU Usage
- CPU Clock
- CPU Temperature
- RAM Usage
- Framerate
Uncheck the others.
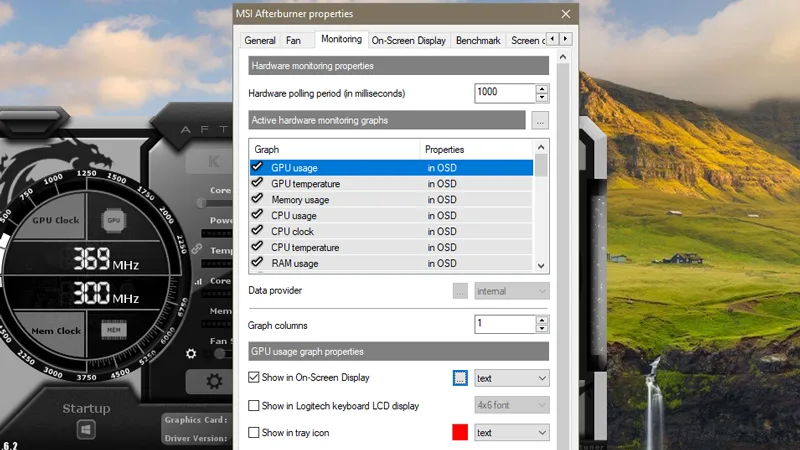
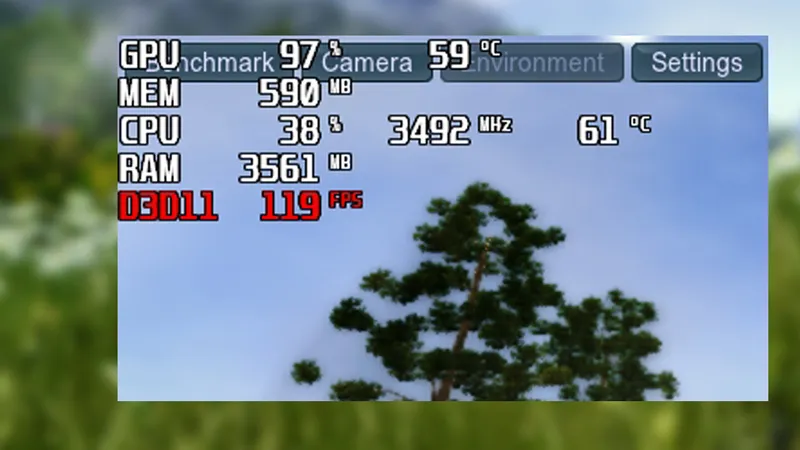
4. Rearrange the metrics by dragging it to where you want to see it. Hold click and use the mouse scroll (middle button) then click Apply. It should look like this.
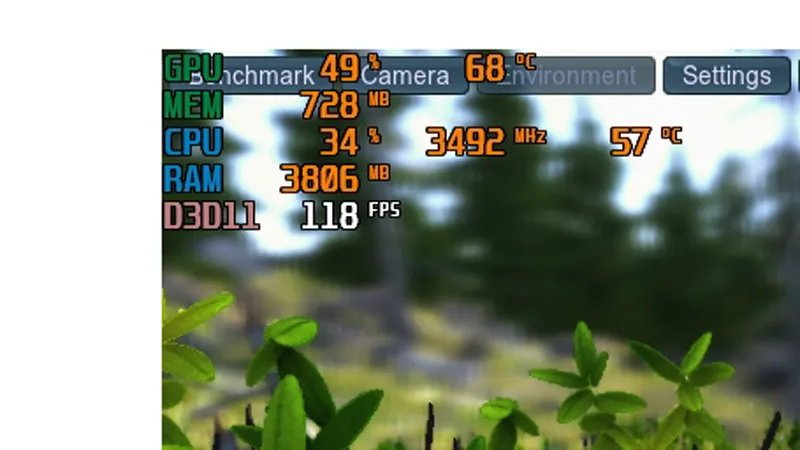
5. Run a game to see the overlay. Make sure the RivaTuner Statistics Server is also running.
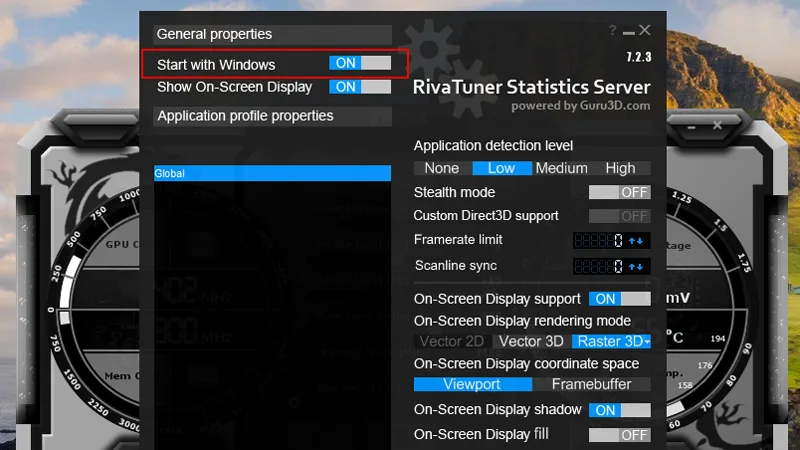
6. If you don’t see the overlay, just run the RivaTuner Statistics Server. The executable file is usually in "C:\Program Files (x86)\RivaTuner Statistics Server\RTSS.exe". Turn ON the “Start with Windows” setting so it will run automatically.
Changing Colors
7. To change the color of the “name” of a metric, click the … button in the Properties section.
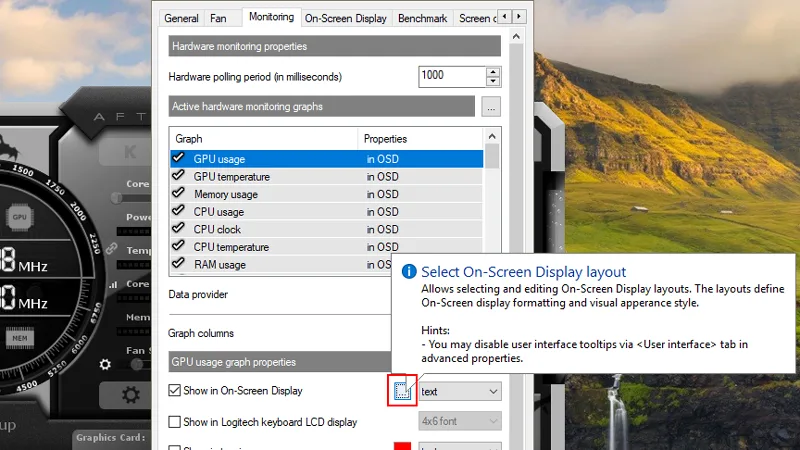
8. Go to “Group color” and look for the item you wanted to change the color. Double-click its current color and a drop-down list will appear, select its new color and click Apply.
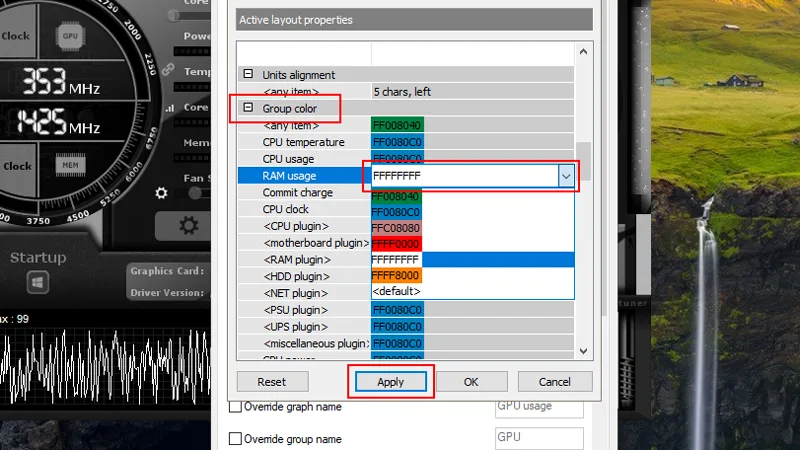
Do the same for all the metrics you selected but choose red for Framerate.
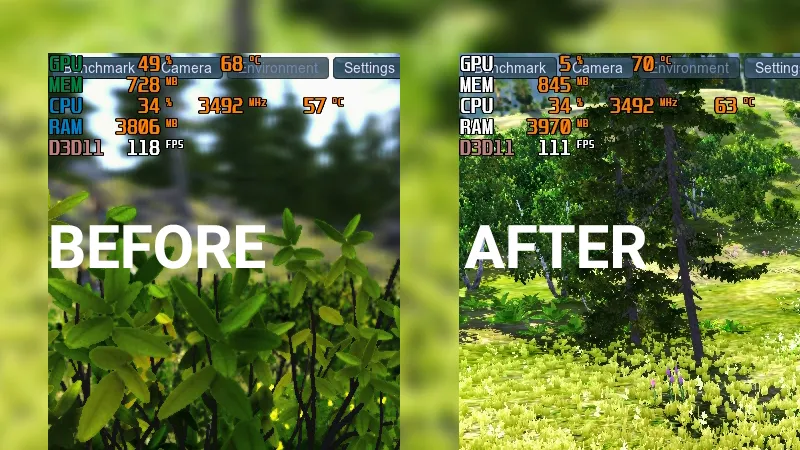
9. To change the color of the values, double-click the color of “System color 0” from “Colors Library”.
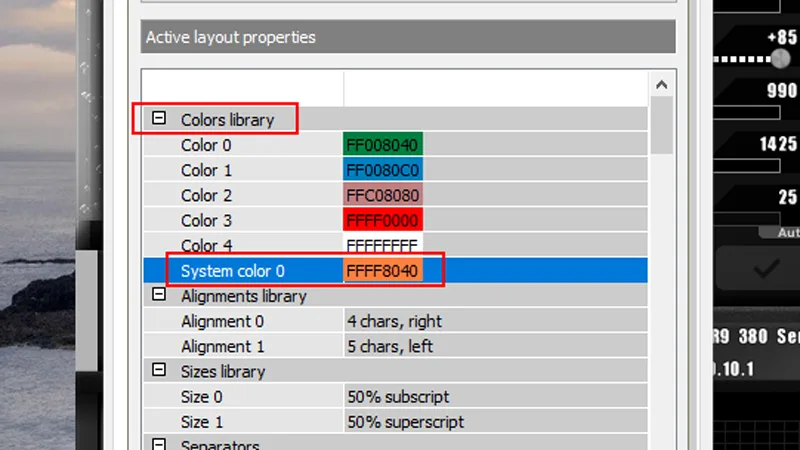
10. Color palette window will appear. From there you can select the new color, then click OK and Apply.
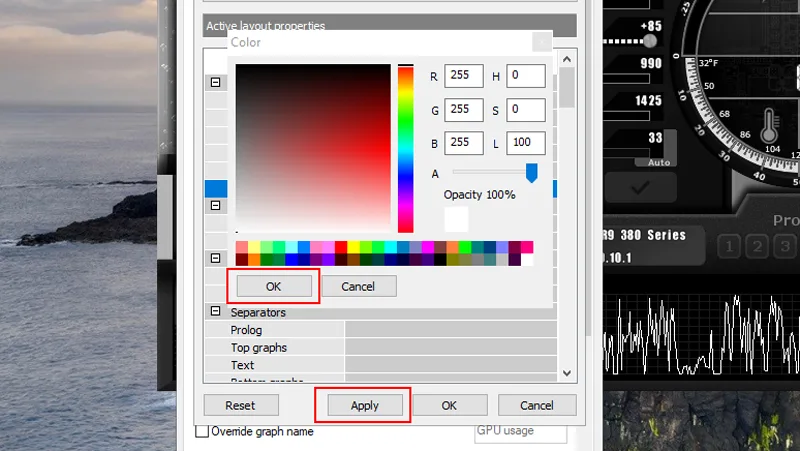
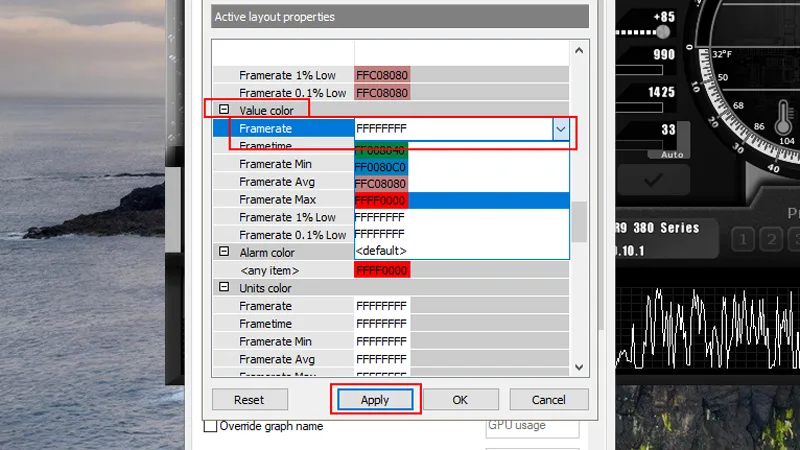
11. To change the value color of the Framerate, go to “Value Color” then double-click the Framerate and select a new color, the same as the color of Framerate which is red. Click Apply and OK.
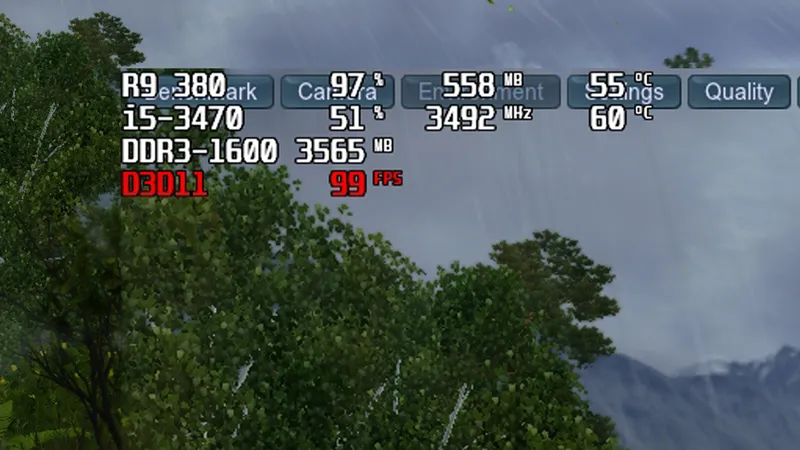
Our overlay now should look like this.
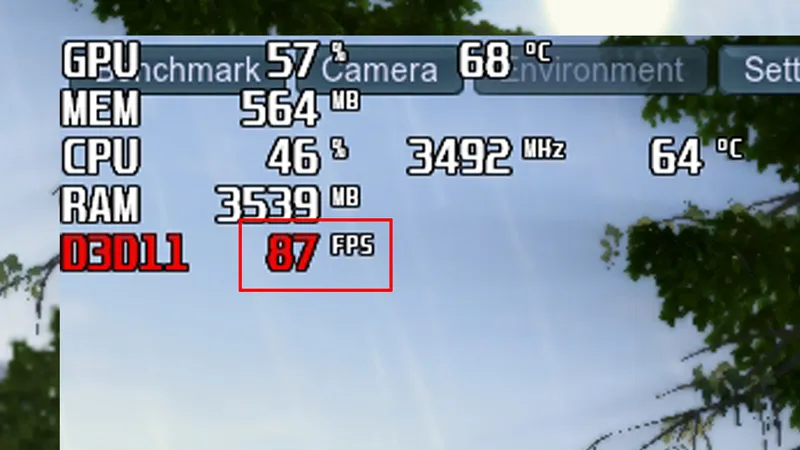
Notice that the “value” (red) and “unit” (white) colors for Framerate are different.
12. To change the unit color of the Framerate, go to “Units color” then double-click the Framerate and select a new color, same as the color of Framerate which is red. Click Apply and OK.
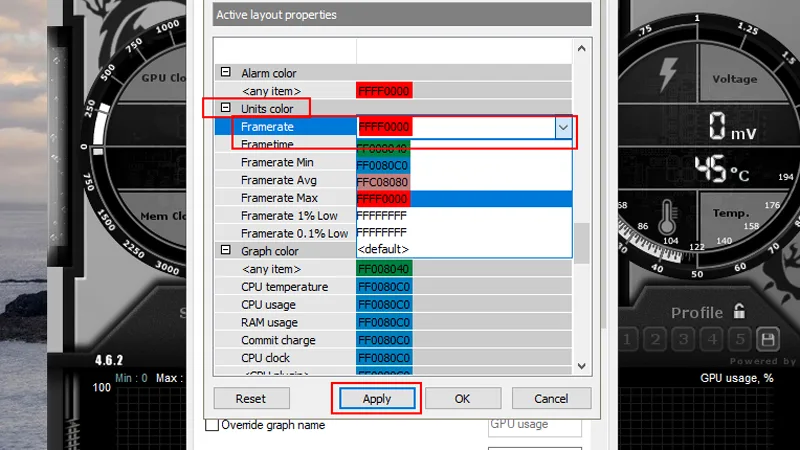
The Framerate value and unit now the same color.
Grouping
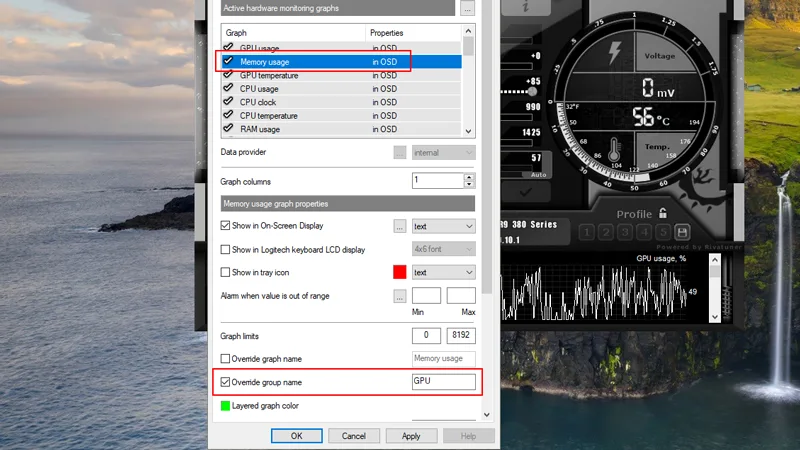
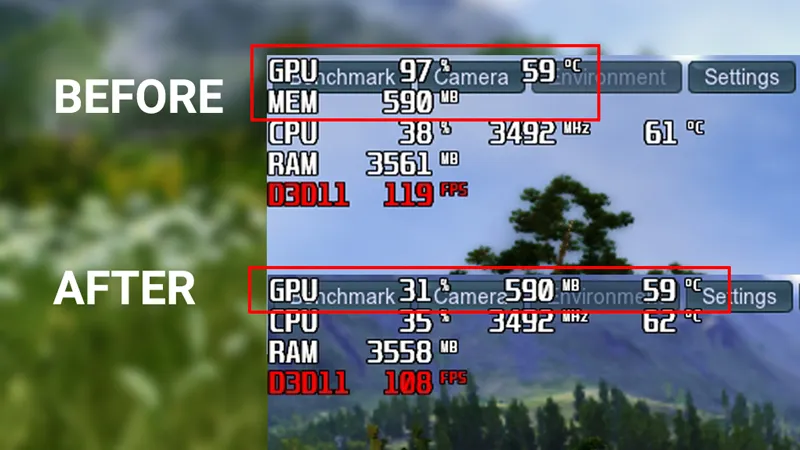
13. We want to add the Memory (Mem) to the GPU group and put it next to GPU Usage. To do that, put Memory after GPU usage from the list. Then first select “Memory usage” in the Monitoring tab then click the checkbox for “Override group name”, then rename it to “GPU” because the group name of GPU usage and temperature is GPU. All metrics with the same group name will be put on the same group.
Memory usage of the graphics card is now on the same line as GPU usage and temperature.
Changing Names
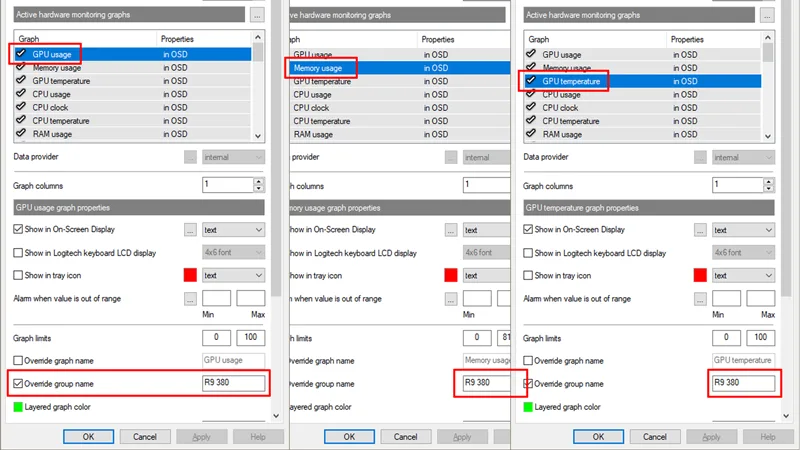
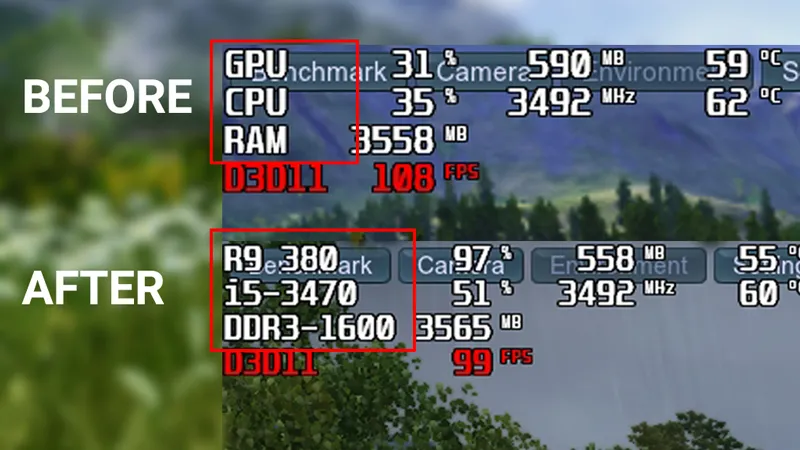
14. You can also change the group name according to what components you have in your system. You can change it from the “Override group name” option. Just keep in mind that the metrics you wanted to group should have the same group name.
Adding Graph
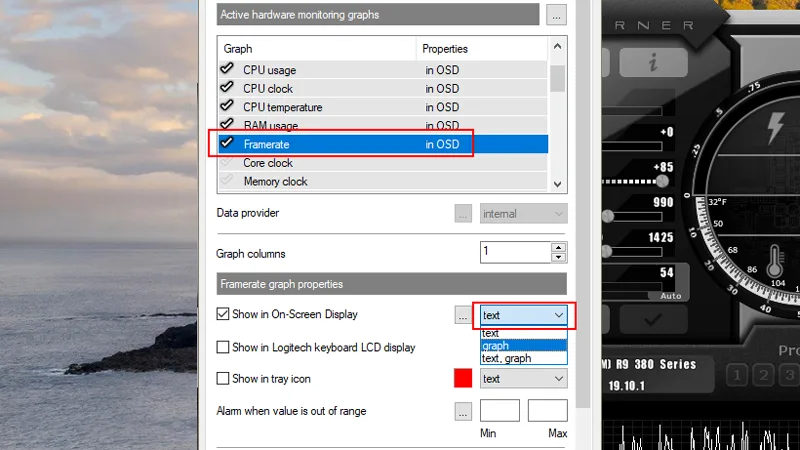
15. To add a graph for your framerate, select the Framerate metric from the list then select “graph” from the drop down list in the “On-Screen Display” option then click Apply.
The graph now appears, replacing D3D11.
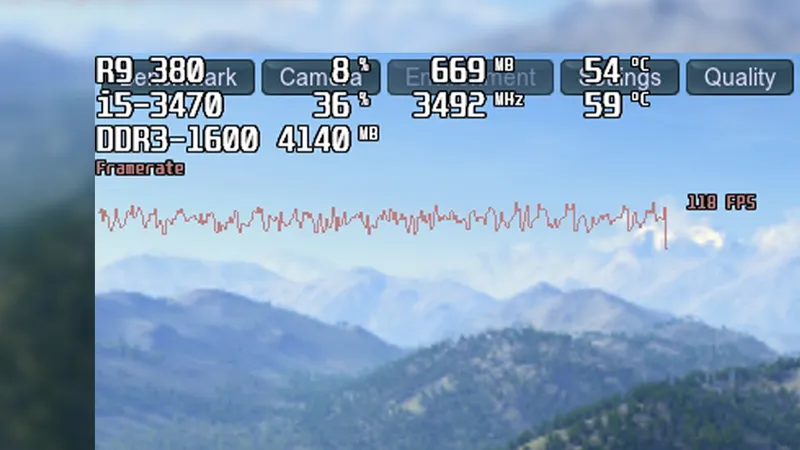
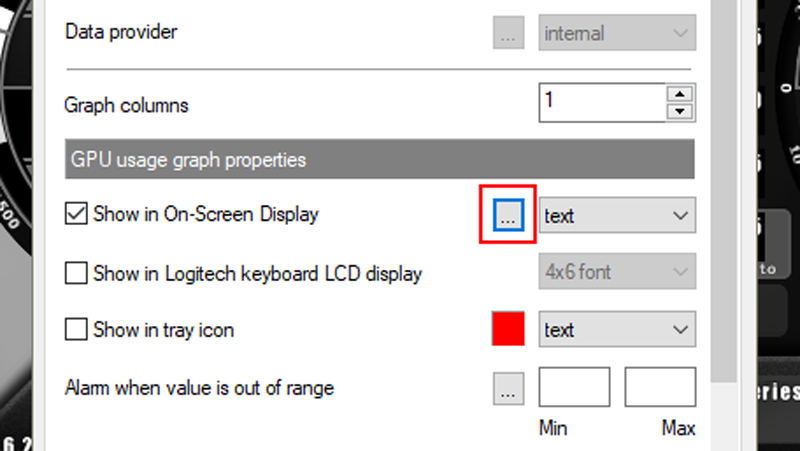
16. Noticed that the graph is not colored red. To change its color, click the “Select On-Screen Display layout” button (…).
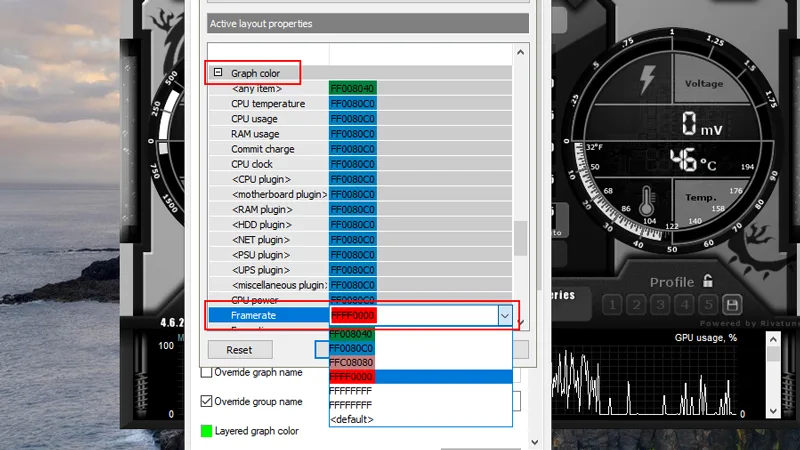
17. Go to graph color, and double-click the “Framerate” designated color. Select the color red then click Apply and OK.
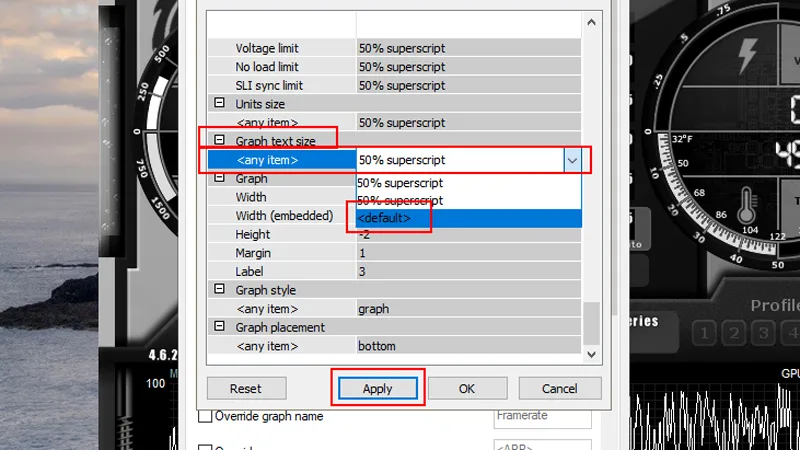
18. To make the Framerate graph texts bigger, go to “Graph text size” then select “” from the drop down list, then click Apply.
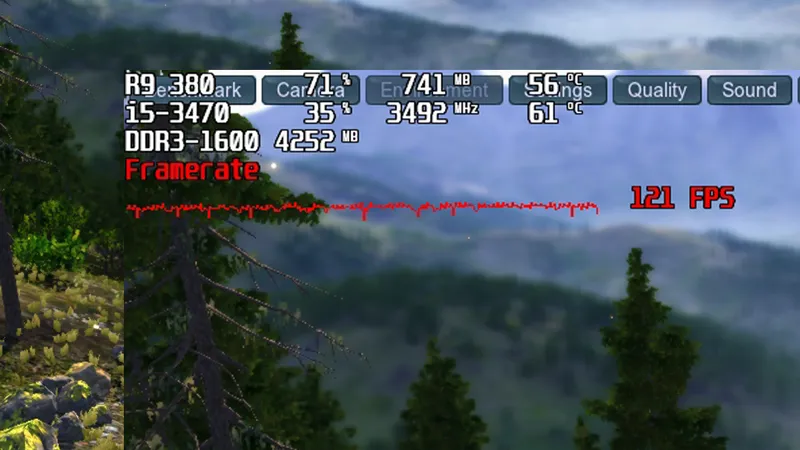
The Framerate graph now looks like this.
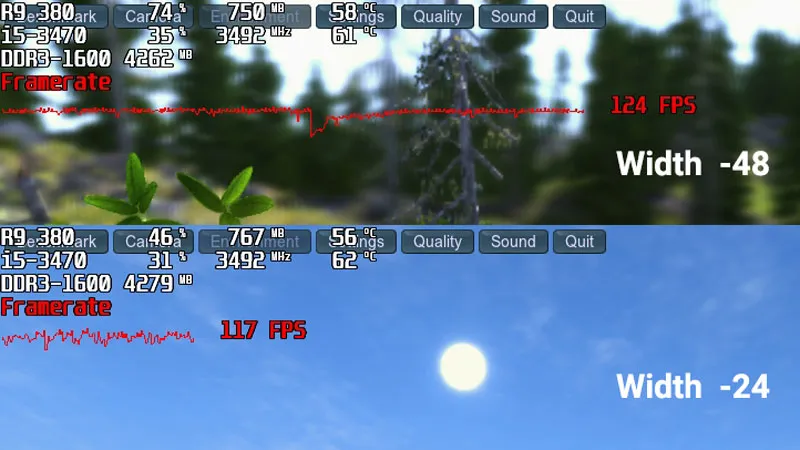
19. To make the graph wider, shorter, or taller, just change the values of width and height from the “Graph” properties.
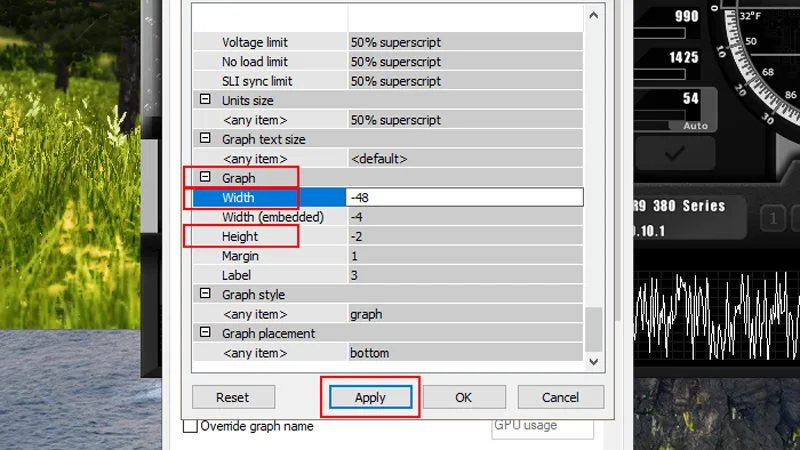
Higher negative values for width will make the graph wider and taller for height.
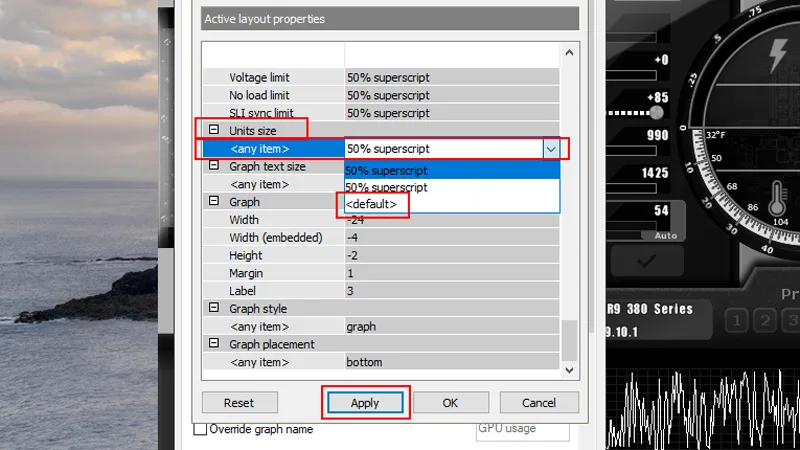
Units Size
20. To make the unit size (MHz, MB, %) be in its normal size, go to “Unit Size” and select “”, then click Apply and OK.
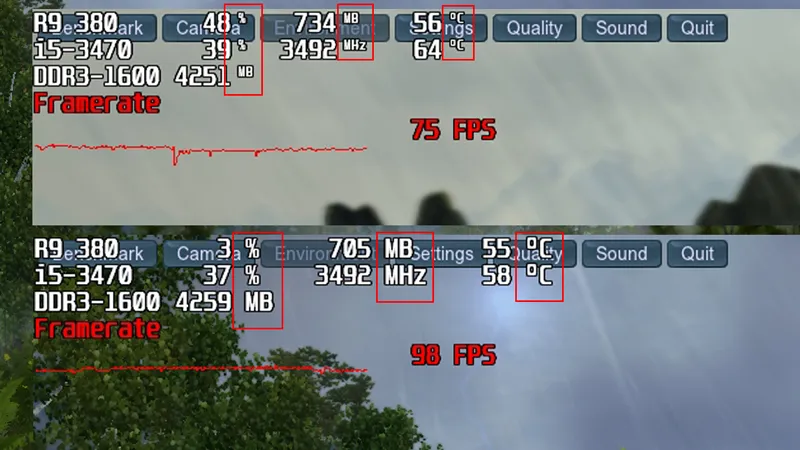
Changing Font and Size
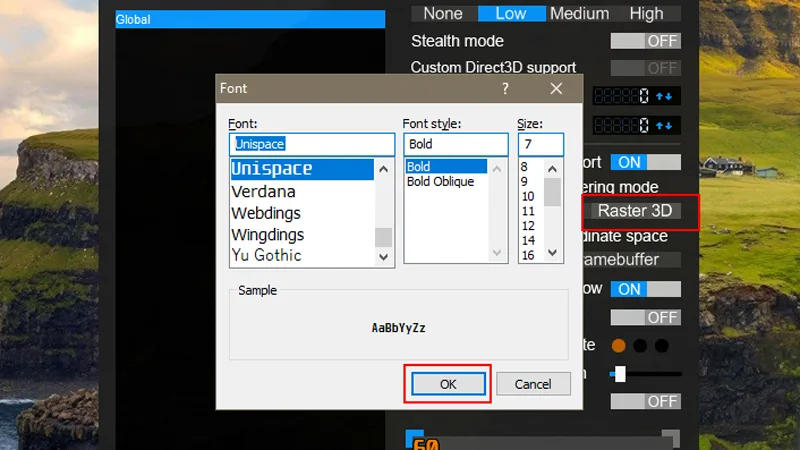
21. To change the font style, open the RivaTuner, click the “Raster 3D” and select the desired font style and size and click OK.
Positioning
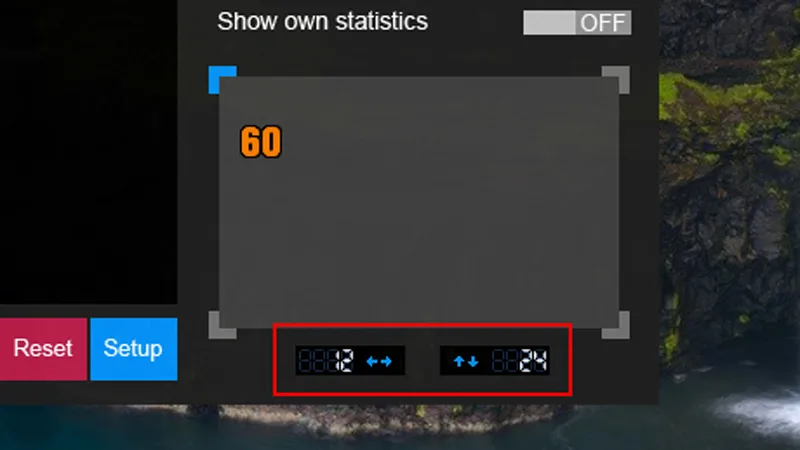
22. To adjust the metrics position, open the RivaTuner Statistics Server then change the value of horizontal and vertical coordinates. It is found on the lower portion the window. You need to press the enter key to apply the new coordinates.
Spacing
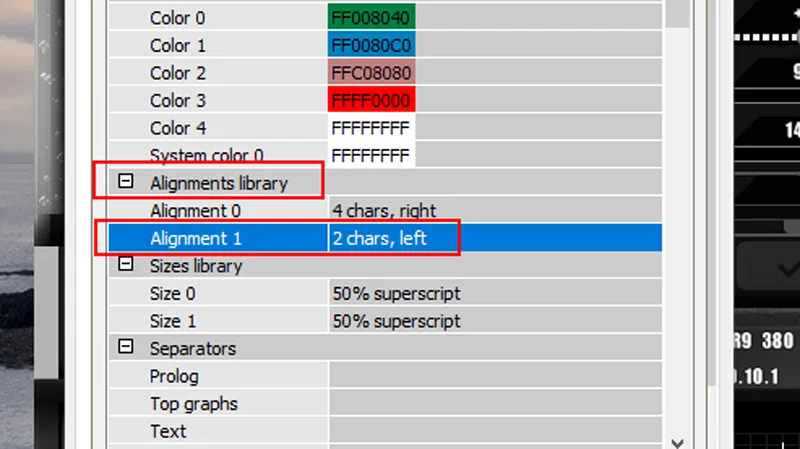
23. To adjust the spaces between columns, click the “Select On-Screen Display layout” button (…), then go to “Alignments library”, double-click the “Alignment 1” then change its value and click OK. Lower value will reduce the spaces between columns.
On-Screen Display Toggle Hotkeys
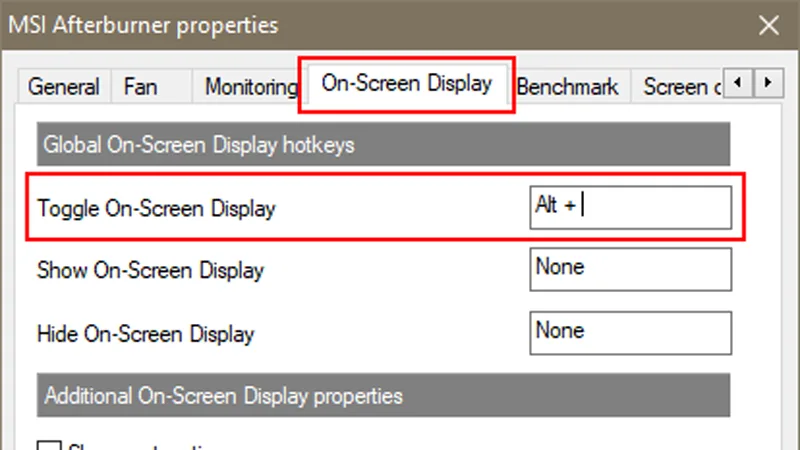
24. To turn on or off the on-screen display, go to “On-Screen Display” tab and press the keys you wanted to use in the “Toggle On-Screen Display” text box.
Here is our customized layout.
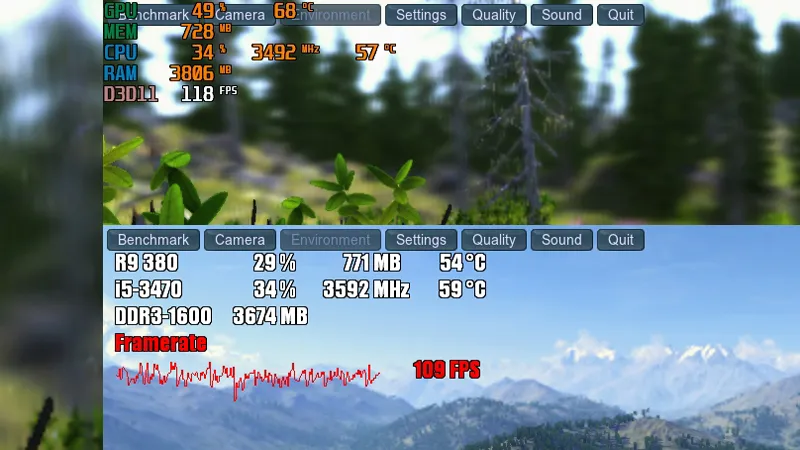
That’s it! Customize your own layout and share it with us using #MyFPSCounter in your posts.
Comments (38)
- Can you share your config file to everyone? Thanks.
- krexivousHow do you stop the overlay report appearing in every monitor in multi-monitor setup?
- Garytry selecting Exclusive Fullscreen in your game settings.
- seanHow do I change CPU/GPU to be a different font colour to the units colour? EG "CPU" reads in red, "GPU" reads in green, and the units are all in orange. Cheers
- Garygo to Changing Colors Step #8
- RafaelIs there a way to change the colors of the units when it goes above certain values? eg. above 75 °C in temp it changes to red or above 95% usage of GPU? Thanks.
- Garyno
- can you check the ram % used.I dont see it
- GAVGreat guide. I didn't know how to do any of that. Now I have a nice custom overlay!
- I cant get it to work...says something about I might be missing some DirectX...but Im afraid to mess up game...I just want an overlay for my temp so that I dont have to check with window.
- Is there a way to have no group name or a blank group name?
- Is there anyway to make it always appear, and not only when in a game? I'd just like to be able to toggle it on/off, no matter what application is being used.
- how to hide this D3D11 what is left of the FPS?
- In settings of “Show in On-Screen Display”, search for “Graphic” and change “label” to “2”
- I changed the group name to '.' and it disappeared for me. Try this, or maybe some other small/invisible character.
- yeeeethow to hide this D3D11 what is left of the FPS?
- ALu_In settings of “Show in On-Screen Display”, search for "Graphic" and change "label" to "2"
- you need to choose graph instead of text, then click on the 3 dots, scroll down to graph and change height to 0
- ALu_Assuming you're using graph style, if not i think it's impossible...
- Joseph M Cutcher IIIHow do i get all of my cores to show up in 1 graph, on the OSD?
- AquinoxHow can I remove the space (empty line) that is automatically placed between system time and other values? (If you check the option - "Show system time", it inserts the system time in OSD and a blank line below it)
- klepackyinsert in seperators -> prolog (\b) without brackets, at the first checkmark in osd hardware monitoring
- Brian SullivanWhy do I get two alternately flashing bars down the left side?
- Brian SullivanNot sure what caused the previous issue, but it's working fine now.
- JoelHi! I don't have the option Show in on-screen display, only Logitech keyboard display. Any idea how to fix this?
- Make sure you install rivatuner statistics server
- DamianGreat guide but I wish you could actually get all the font colours to match. Does anyone else find that moving the position through Rivatuner doesn't work at all? Cheers
- wajahatgood job nice post
- Yeah, I don't have the section with the on-screen display option. I have the area where you can check each item, and even a graph, just no on-screen display option.
- Make sure you install rivatuner statistics server
- CouchWatermelonI was Wondering if there was a way to change the opacity of more values than just framerates? Rivatuner allows the change in color and opacity of only framerates as far as I can find. Any help is appreciated!
- is it possible to remove that D3D11 text from framerate? like make it transparent so that only the values are visible.
- munder group colours, GPU does not show up. am i missing something?
- AllexThank you , that was useful.
Comments are closed.